
“So
you dig into the history of data. You fight metadata friction, the difficulty
of recovering contextual knowledge about old records.” – Without historical
data there would be no data today.
To
begin: Aggregation is the constituting or amounting to a whole; total- bringing
things together
Distribution
is the opposite of aggregation but put in words: the act of dispersing
The
reading entitled A Vast Machine: Computer Models, Climate Data, and the
Politics of Global Warming is about how Edwards is trying to aggregate the
arguments and models of climate change into one source.
The
reading offered more or less a timeline of how scientists learnt to understand
the environment- and from this then- how different models for data analysis of
climate change have progressed and changed and importantly what these changes
mean in developing our understanding of information.
Edwards
says the Infrastructural Globalism needs socio technical systems that produce
knowledge about the whole world. However Global Data needs multiple images to
replicate change as one image is not useful in demonstrating a theory as big as
Global Warming.
Aggregation
is used to analyse information efficiently. Scientific models are the best way,
(Edward) to predict the future impacts of changes. Without models, would the
data really exist?
Statistics
are thus used in models. It is here that frictional data can be observed.
It
is data friction because it is close to impossible to term something a ‘fact’
when talking about global warming. There are so many representations of data
and models that they over-lap and contradict each other.
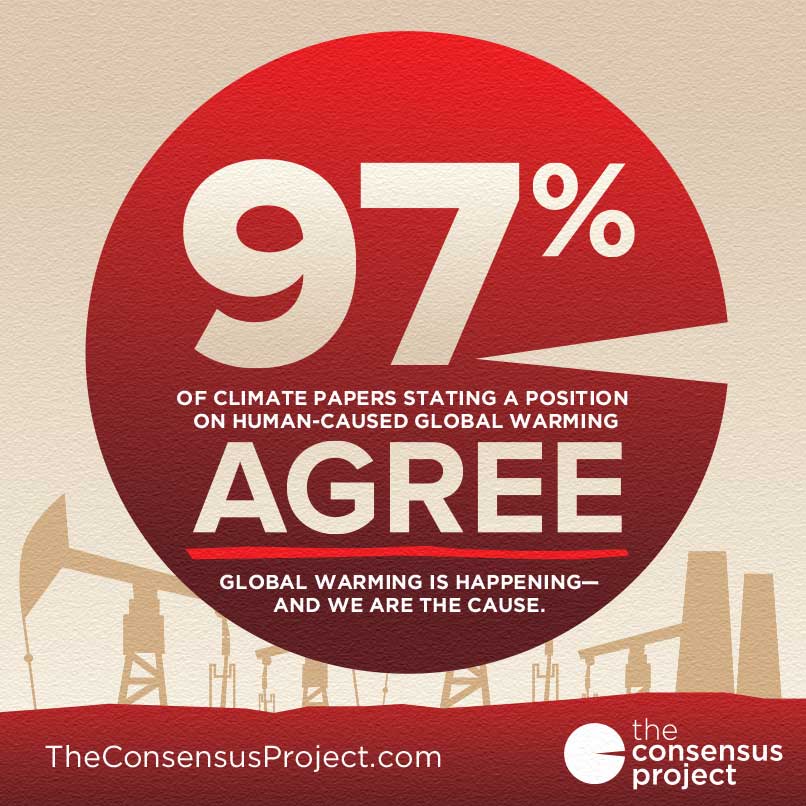
Within
climate change, there are two sides to the story. Some say it’s happening, some
say it’s not. If we were to go back to the original data they used to make these
suggestions, there would probably be a debate then about what a certain
statistic means – because your views will be based on data you have seen before
that, and before that, and before that….etc.
In
my own personal views of aggregation, I find it interesting to think how the
creation of a hash tag is formed. When I hash tag something on instagram, it’s
been done a million times before. To some people, the hash tag has different
meanings. For example I hash tagged ‘billgates’ the other day. When I view the
global hash tags for Bill Gates, it’s anything from a computer to a dog wearing
glasses.

I
guess after reading the Edwards article it made me realize that you own
interpretation of data is always going to be what you base your future
interpretations of data on.
No comments:
Post a Comment